
Skip to content
Flalingo

English practice

IELTS Academic Writing Task 1 line graph: how to compare two lines and report the figures accurately

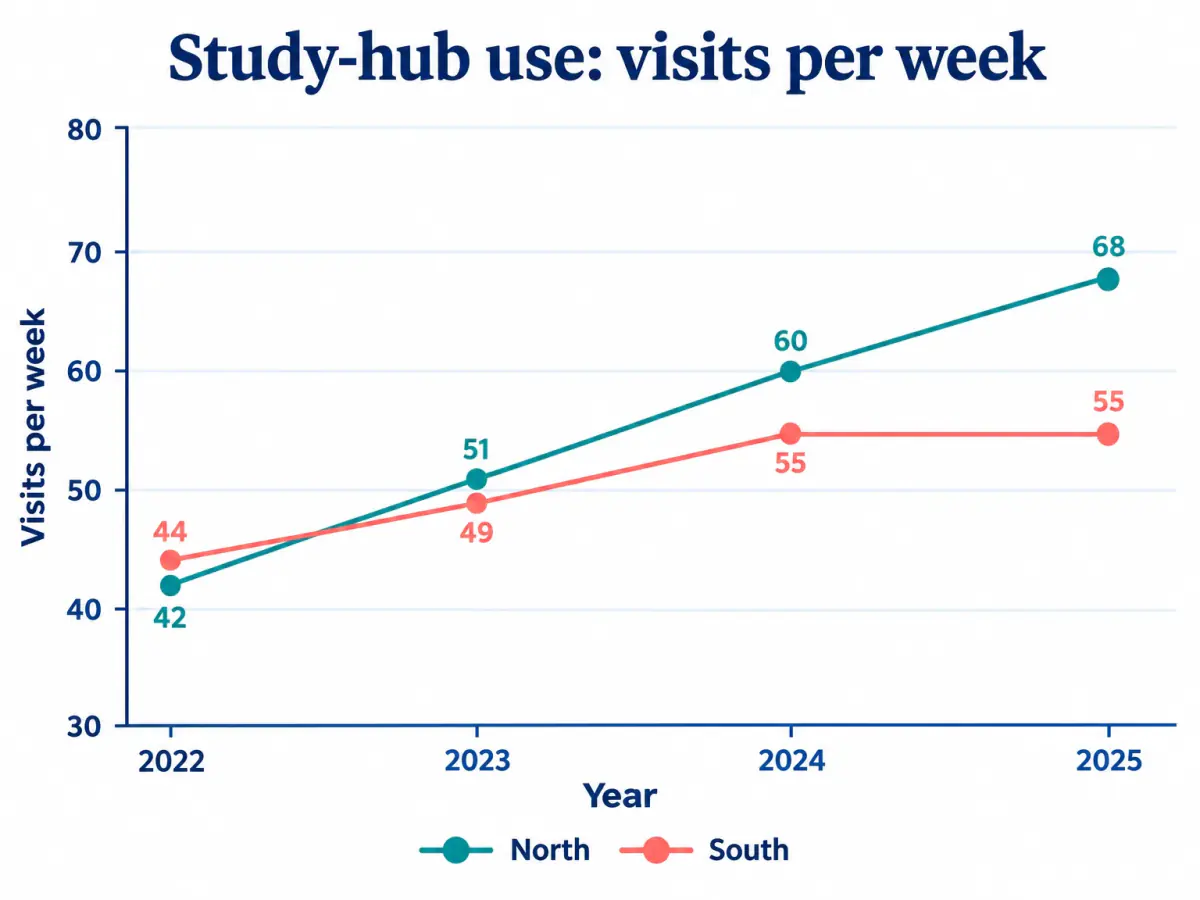
Study-hub visits line chart

How to describe a two-line graph in IELTS Academic Writing Task 1: an overview first, trend verbs, from … to versus by, while and whereas, and which sentences to change when the figures change. For B2 candidates and above.

In IELTS Academic Writing Task 1, describe a two-line graph from the overall pattern down: which line rose, which fell or levelled off, and where the lines crossed. Then add a few selected figures, using from … to for start and end values and by for the size of a change. Report only what the graph shows and never add a cause it does not give. This guide is for IELTS Academic candidates with upper-intermediate (B2) English or above.

Who this is for

  • Candidates who report every number on the graph but never say what the overall pattern is.
  • Writers who mix up an end value with the size of a change, or counts with percentages.
  • Candidates who correct one figure in a draft and leave the sentences that depended on it.
  • Too early: if academic English still takes you a long time to read, start with the IELTS Academic Reading guides below; they train the same habit of checking each claim against evidence.
  • Too easy: if your line-graph reports are already accurate, move on to process diagrams, the Task 1 visual built on stages rather than numbers (links below).

Open the sample pages

Open the sample pages

Word cards

rise / fall + adverb

Use a trend verb with an adverb to show direction and speed.

Visits to the North hub rose steadily between 2022 and 2025.

level off / remain stable

Use level off or remain stable when a line stops rising or falling.

Visits to the South hub levelled off at 55 after 2024.

from … to / by

Use from … to for the start and end values and by for the size of the change.

North visits increased from 42 to 68, a rise of 26.

past simple for a finished period

Use the past simple when the whole time frame is in the past.

In 2023, North overtook South for the first time.

while / whereas for two lines

Use while or whereas to compare two trends in one sentence.

North continued to rise, whereas South remained unchanged.

Example exchange

How can the change be grouped?

North climbed steadily from 42 to 68. South rose to 55, then remained unchanged.

Two sentences group direction and endpoint without an unsupported cause.

  • climbed steadily
  • rose to
  • remained unchanged

Language pattern

How can the change be grouped?

North climbed steadily from 42 to 68. South rose to 55, then remained unchanged.

Two sentences group direction and endpoint without an unsupported cause.

  • climbed steadily
  • rose to
  • remained unchanged

More practice

Check the evidence

Study-hub visits line chart

Study-hub use: visits per week: 2022 — North 42; South 44; 2023 — North 51; South 49; 2024 — North 60; South 55; 2025 — North 68; South 55

Study-hub use: visits per week

  • 2022 — North 42; South 44
  • 2023 — North 51; South 49
  • 2024 — North 60; South 55
  • 2025 — North 68; South 55
  1. Which verb accurately describes North?

    Show answer and explanation

    climbed steadily

    North increases at every interval.

  2. Which statement is supported for South?

    Show answer and explanation

    It levelled off at 55 after 2024.

    South is 55 in both 2024 and 2025.

  3. Which claim must be excluded?

    Show answer and explanation

    A marketing campaign caused the rise.

    The data provides no cause.

Report Line-Graph Trends: transfer

Study-hub visits line chart

Study-hub use: visits per week

  • 2022 — North 42; South 44
  • 2023 — North 51; South 49
  • 2024 — North 60; South 55
  • 2025 — North 68; South 55

Reporting controls

  • Unit: weekly visits
  • Time frame: 2022–2025
  • Overview: both rose at first; North continued rising while South levelled off
Learn this unit
How would you like to learn?
Have an account?

A free account opens one unit for good.

Read the graph before you write

The practice graph on this page shows weekly visits to two study centres, North and South, from 2022 to 2025. Before choosing a verb, check:

  • Units: visits per week, so counts, not percentages.
  • Time frame: 2022 to 2025, finished, so use the past simple.
  • North: 42, 51, 60, 68, rising at every step.
  • South: 44, 49, 55, 55, rising and then staying at 55.
  • Key moments: South starts slightly higher; North leads from 2023; the gap is widest at the end.

Start with an overview

The task instruction usually ends: “Summarise the information by selecting and reporting the main features, and make comparisons where relevant.” Selecting is the skill. An overview gives the main pattern in a sentence or two, with few or no numbers, and the Task 1 marking criteria refer to it directly.

For this graph: “Overall, North grew throughout the period, whereas South rose at first and then levelled off.”

The recorded model on this page asks “How can the change be grouped?” and answers “North climbed steadily from 42 to 68. South rose to 55, then remained unchanged.” One sentence per line, not eight numbers.

Trend verbs that match the shape

Choose the verb from the shape of the line, then add an adverb for speed. Each card on this page has a recording.

  • “rose steadily” or “climbed steadily”: regular growth, like North’s rises of 9, 9 and 8.
  • “rose sharply”: a large change in a short time, unlike North’s even steps.
  • “levelled off at 55” or “remained unchanged”: a line that stops moving, like South after 2024. American “leveled” is also correct.
  • “fluctuated” means up and down, so not for a line moving one way.
  • Vary with nouns: “a steady rise in visits to North”.

From … to, by and the past simple

Small words decide whether figures are right: “North visits increased from 42 to 68, a rise of 26.”

  • “from 42 to 68” gives the start and end; “by 26” or “a rise of 26” gives the change. “Increased by 68” would be wrong.
  • South rose by 11 visits a week, not 11 percent, and 44 to 55 is not “doubled”.
  • A finished period takes the past simple: “In 2023, North overtook South for the first time.” For forecast years, use “is expected to”.

Comparing two lines

With two lines, the comparison is the point:

  • “while” or “whereas” joins two clauses: “North continued to rise, whereas South remained unchanged.”
  • “However” starts a new sentence, followed by a comma.
  • “overtook” marks the crossing point; “remained ahead” covers what follows.
  • “the gap widened to 13 visits” turns two end values into one comparison.
Learn this unit your way

When the final figures change

Now change the final year to North 64 and South 59. Check each claim, as you would after spotting a misread value in the exam, and change only what the new figures affect:

  • North still rose every year, more slowly at the end: from 42 to 64, a rise of 22.
  • South no longer levelled off; it rose throughout, by 15.
  • North still overtook South in 2023, but the final gap is 5 visits, not 13.
With the new figures, which sentence must go?

Mistakes that cost marks

Check each practice report for these:

  • No overview, or one hidden among the numbers.
  • A cause the graph does not give: “because of a marketing campaign”.
  • “to” and “by” mixed up, or counts called percentages.
  • A verb that misfits the shape: “fluctuated” for a line that only rose.
  • Every value listed year by year.

A 20-minute exam routine

Three times a week, one graph, timed:

  • 3 minutes: mark units, years, highs and lows, crossings and end values.
  • 2 minutes: write the overview first.
  • 12 minutes: a one-sentence introduction in your own words, the overview, two grouped detail paragraphs.
  • 3 minutes: check every number and verb against the graph; delete any cause.
  • Afterwards, change one value and rewrite only what it affects.

What comes next

Process diagrams are another Task 1 visual: stages instead of numbers, usually in the passive, and they need an overview too. Writing Task 2 then needs arguments that claim no more than the evidence shows.

Frequently asked questions

How many words should I write for IELTS Writing Task 1?

At least 150. Aim slightly above that and take about 20 minutes, because Task 2 counts twice as much.

Do I need a conclusion in IELTS Writing Task 1?

Not an opinion or an essay-style conclusion, but a clear overview of the main trends, after the introduction or at the end.

How is IELTS Writing Task 1 marked?

On four equally weighted criteria: Task Achievement, Coherence and Cohesion, Lexical Resource, and Grammatical Range and Accuracy.

Flalingo is not affiliated with or endorsed by the organisations that administer IELTS.

Learn this unit
How would you like to learn?
Have an account?

A free account opens one unit for good.

What comes next?

Keep practising with Flai

Flai is Flalingo's AI speaking-practice app, with voice conversations, corrections and lesson reports to guide your practice.

Learn with a live teacher

In Flalingo lessons you practise units like this one-to-one with a live teacher.